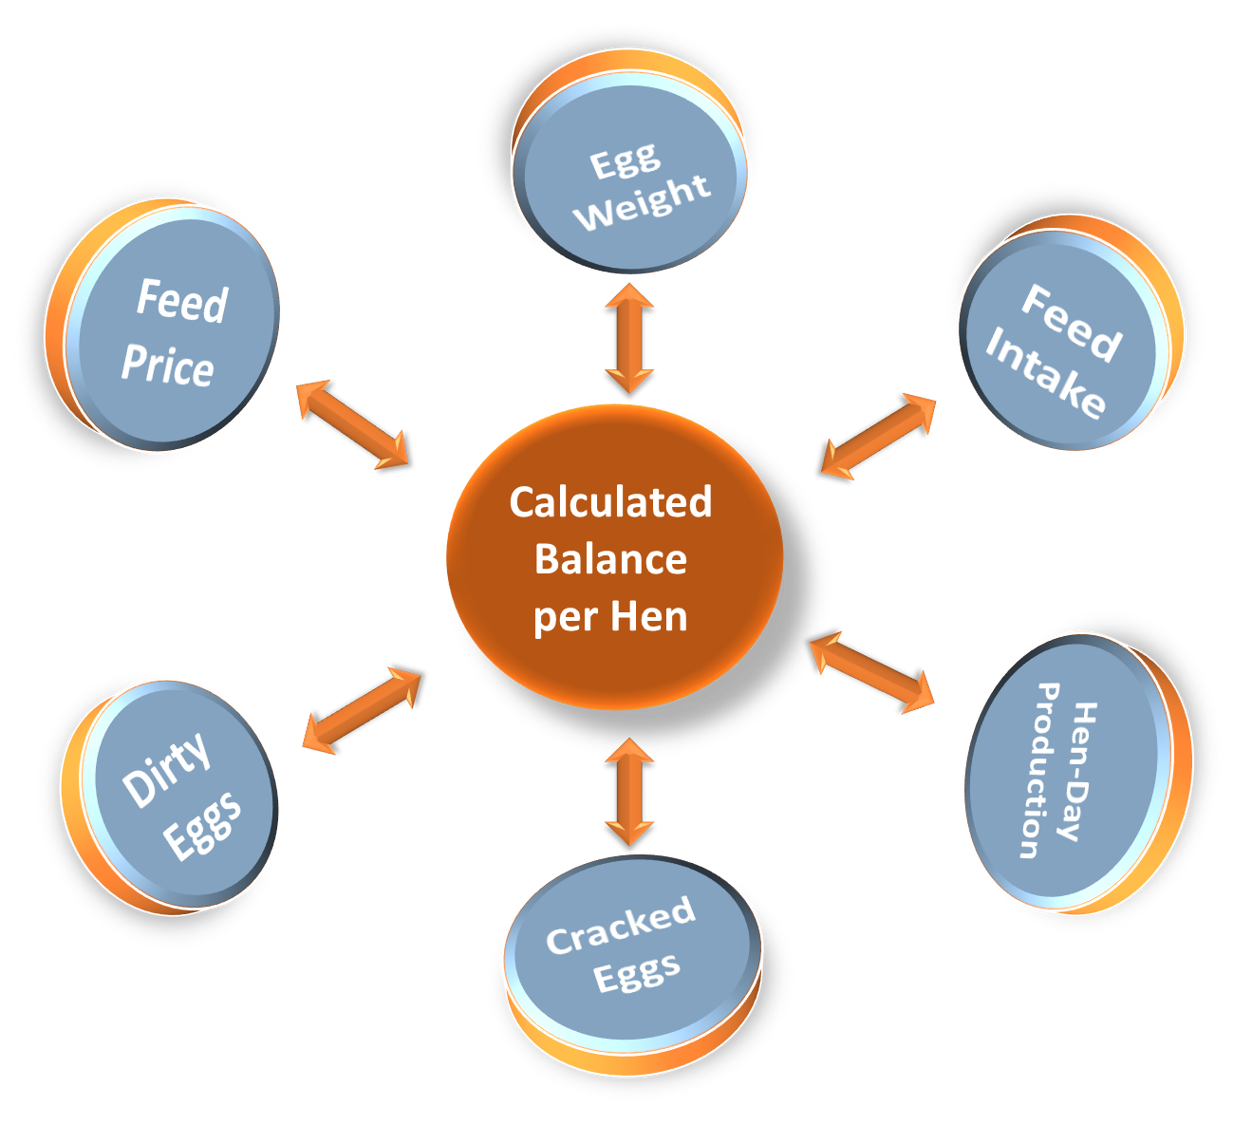
The application is designed to examine the cost of various variables in laying hen feeds compared to the benefit of improving the performance by those variables and their financial gain. This is an effective and useful tool for farmers giving them an opportunity to achieve optimal economic decisions as well as for nutritionists who can examine the variables in field trials, with reference to the manufacturer's statements on performance improvement.
Egg Category | Egg Price (€) |
XL > 73 grams | |
63 < L > 73 grams | |
53 < M > 63 grams | |
S < 53 grams | |
Cracked Eggs | |
Dirty Eggs |
Indices |
Current flock
Enter the current flock data |
Δ
Enter the difference (Δ) |
|
Feed price | € per ton | ||
Avg.egg weight | gr | ||
Daily feed intake | gr | ||
Hen-day production | % | ||
Cracked eggs | % | ||
Dirty eggs | % |
Update the net egg price (€) by categories.
"Current Flock" column should include the flock's current data:
Feed price including transportation
Avg. egg weight (gram)
Avg. daily feed consumption (gram)
Flock's current hen-day production
Flock's current percentage of cracked eggs
Flock's current percentage of dirty eggs
"Δ" column is the new data that should be entered. The Δ can be positive or negative.
i.e: Egg weight increased by 3 gram enter 3 (not absolute EW)
Calculate button will compute the difference in euro per hen/month. If the result due to changes is positive
then there is a financial gain, if negative, there is a financial loss.
The "What-If" Analysis allows us to calculate the Δ index by resetting calculated balance per hen for the upcoming month (€).